I teach at public universities, design courses on online learning platforms, and lead hands-on workshop sessions.
Teaching
2024

Data Storytelling for Strategic Communication
A three-hour workshop by WUD and Sheldon.studio dedicated to data storytelling, and specifically designed for marketing and communication directors interested in learning how transform numbers and statistics into compelling narratives.
MY ROLE: Workshop Lead

Gathering data to dismantle gender-based hate speech
Two sessions with the title 'Producing data: a workshop on the politics of data', mixing theory and practice to provide guidance in how to gather data from a transfeminist, intersectional perspective and use data as a tool for consciousness-raising, advocacy and education.
MY ROLE: Workshop Lead

Communication of Statistics and Data Business Analytics
The course covered the main skills related to data communication, such as the design of a data communication product, from the sourcing and interpretation of data to their graphic representation; and the creation of data visualizations, charts, and dashboards using the main tools of the industry. The course comprised of both frontal lessons and practical exercises.
MY ROLE: Contract Professor

Spatial data visualization
A seminar on the theory and practice of visualizing spatial data, for PhD students in Geography of the University of Rome.
MY ROLE: Instructor

Green Culture
Faculty of the training for Cultural Organizations showcasing best practices and case studies on data & green transition.
MY ROLE: Instructor
2023
Communication of Statistics and Data Business Analytics
The course covered the main skills related to data communication, such as the design of a data communication product, from the sourcing and interpretation of data to their graphic representation; and the creation of data visualizations, charts, and dashboards using the main tools of the industry. The course comprised of both frontal lessons and practical exercises.
MY ROLE: Contract Professor

Digital Data and Knowledge Production MOOC
An online course for professionals working in the cultural heritage sector.
MY ROLE: Workshop Ideator

Data Journalism Training Program
A hands-on and project-oriented learning program on data journalism students. For the programm, I led co-design sessions, created the educational content, supported the students and reviewed their projects, and oversaw the program progress.
MY ROLE: Teacher, tutor, and learning manager

Data journalism for researchers
A workshop for researchers and PhD students on what data journalism can teach about communicating science and data to a wide audience.
MY ROLE: Workshop Lead

Digital Tools for data journalism
A 6-day workshop for employees of Withub, teaching how to handle, process and visualize data for newsrooms.
MY ROLE: Workshop Lead

Data Visualization in High School
Slides, activity design and templates for a data visualization workshop targeted at high-school students.
MY ROLE: Workshop Ideator

Critical Approachest to data visualization
A hands-on masterclass on designing and producing data visualizations, for the students of the Master DiDe in Digital Design, within the module 'Truth vs. Post-Truth'.
MY ROLE: Instructor
2022
Data Journalism Training Program
A hands-on and project-oriented learning program on data journalism students. For the programm, I led co-design sessions, created the educational content, supported the students and reviewed their projects, and oversaw the program progress.
MY ROLE: Teacher, tutor, and learning manager

Data Capacity-Building Training Program
A hands-on and project-oriented learning program on data journalism students. For the programm, I led co-design sessions, created the educational content, supported the students and reviewed their projects, and oversaw the program progress.
MY ROLE: Teacher, tutor, and learning manager
Communication of Statistics and Data Business Analytics
The course covered the main skills related to data communication, such as the design of a data communication product, from the sourcing and interpretation of data to their graphic representation; and the creation of data visualizations, charts, and dashboards using the main tools of the industry. The course comprised of both frontal lessons and practical exercises.
MY ROLE: Contract Professor
Spatial data visualization
A one-day seminar on the theory and practice of visualizing spatial data, for PhD students in Geography of the University of Rome.
MY ROLE: Instructor
2021
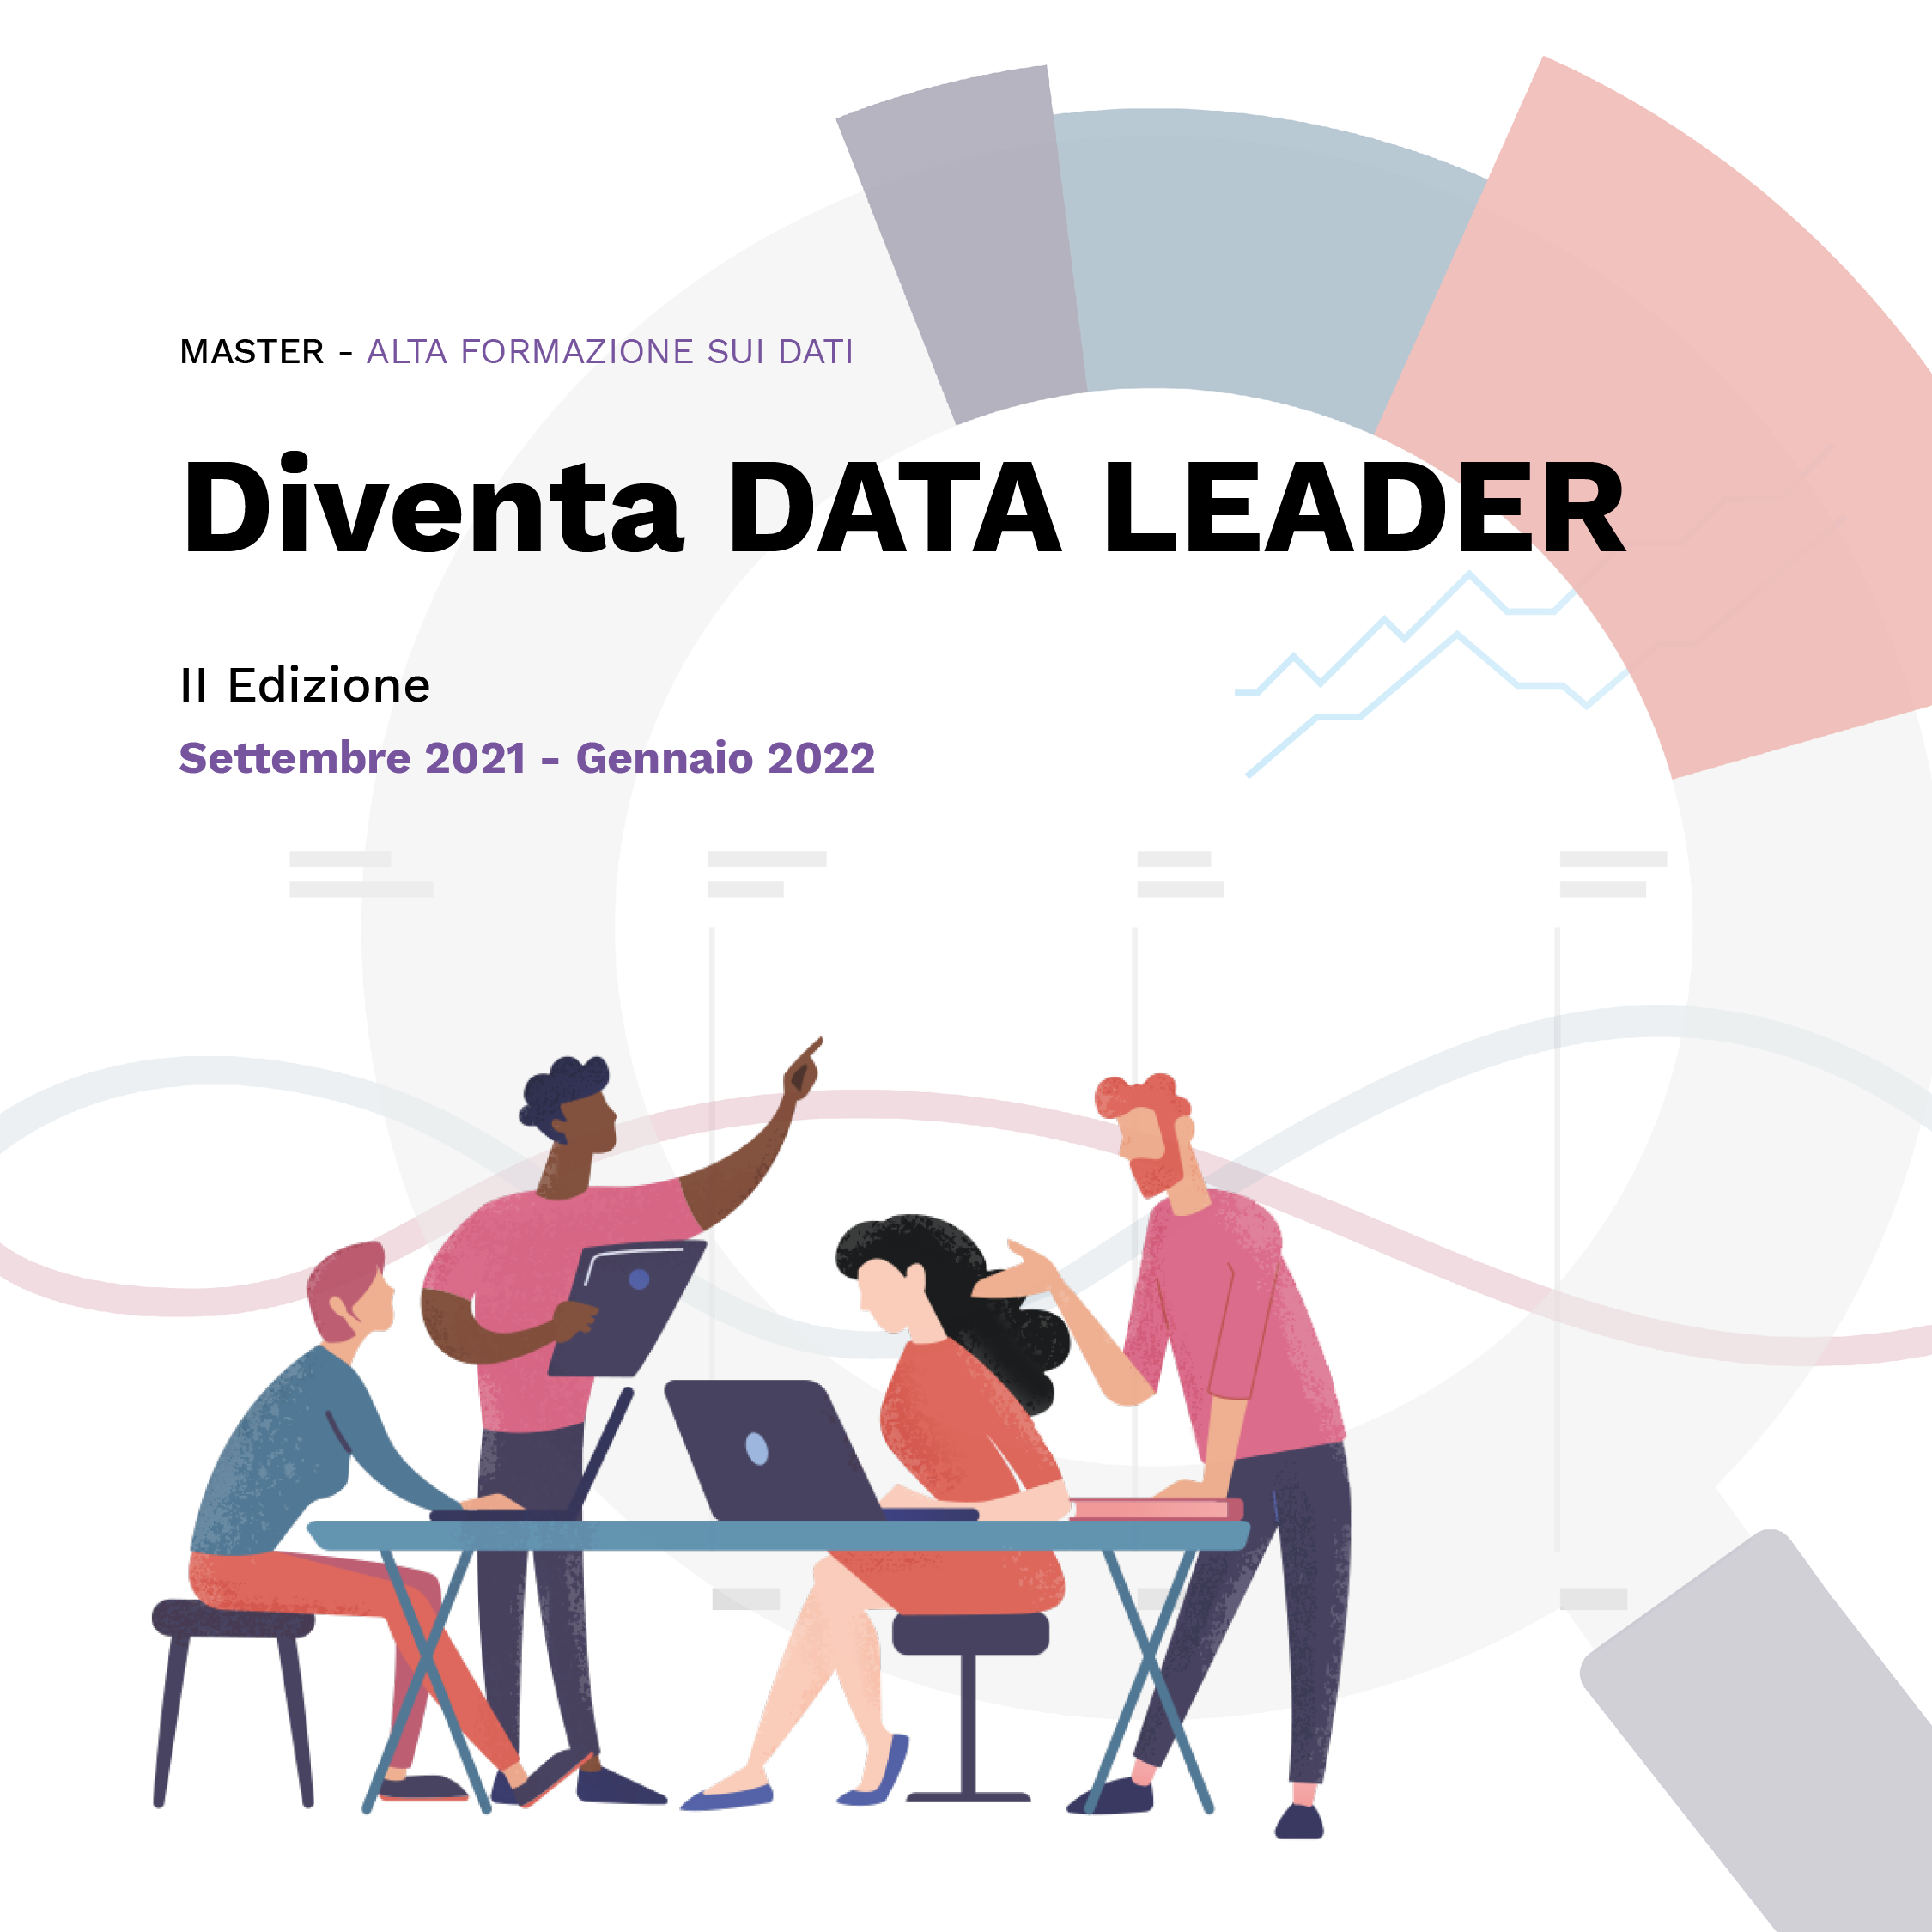
Master Alta Formazione sui dati Ed.2
16-weeks intensive learning program on data literacy, statistics, data visualization, and storytelling. I taught lessons on data formats, data sources, GSheet basic and advanced uses, Open Refine and data cleaning, Google Data Studio and dashboards, and data visualization with Datawrapper, Flourish, and Infogram. I also supported students in developing their group projects with the program's data partners: Fondazione Compagnia di San Paolo; Produzioni dal Basso; and SeaWatch.
MY ROLE: Teacher, tutor, and learning manager
2021 Fellowship Program, Marimekko Cohort
The fellowship guided 4 East African NGOs in creating a data storytelling project to communicate their own datasets. I taught sessions on data storytelling techniques and the use of Datawrapper, based on Data4Change's program.
MY ROLE: Cohort Tech Support
Communication of Statistics and Data Business Analytics
The course covered the main skills related to data communication, such as the design of a data communication product, from the sourcing and interpretation of data to their graphic representation; and the creation of data visualizations, charts, and dashboards using the main tools of the industry. The course comprised of both frontal lessons and practical exercises.
MY ROLE: Contract Professor
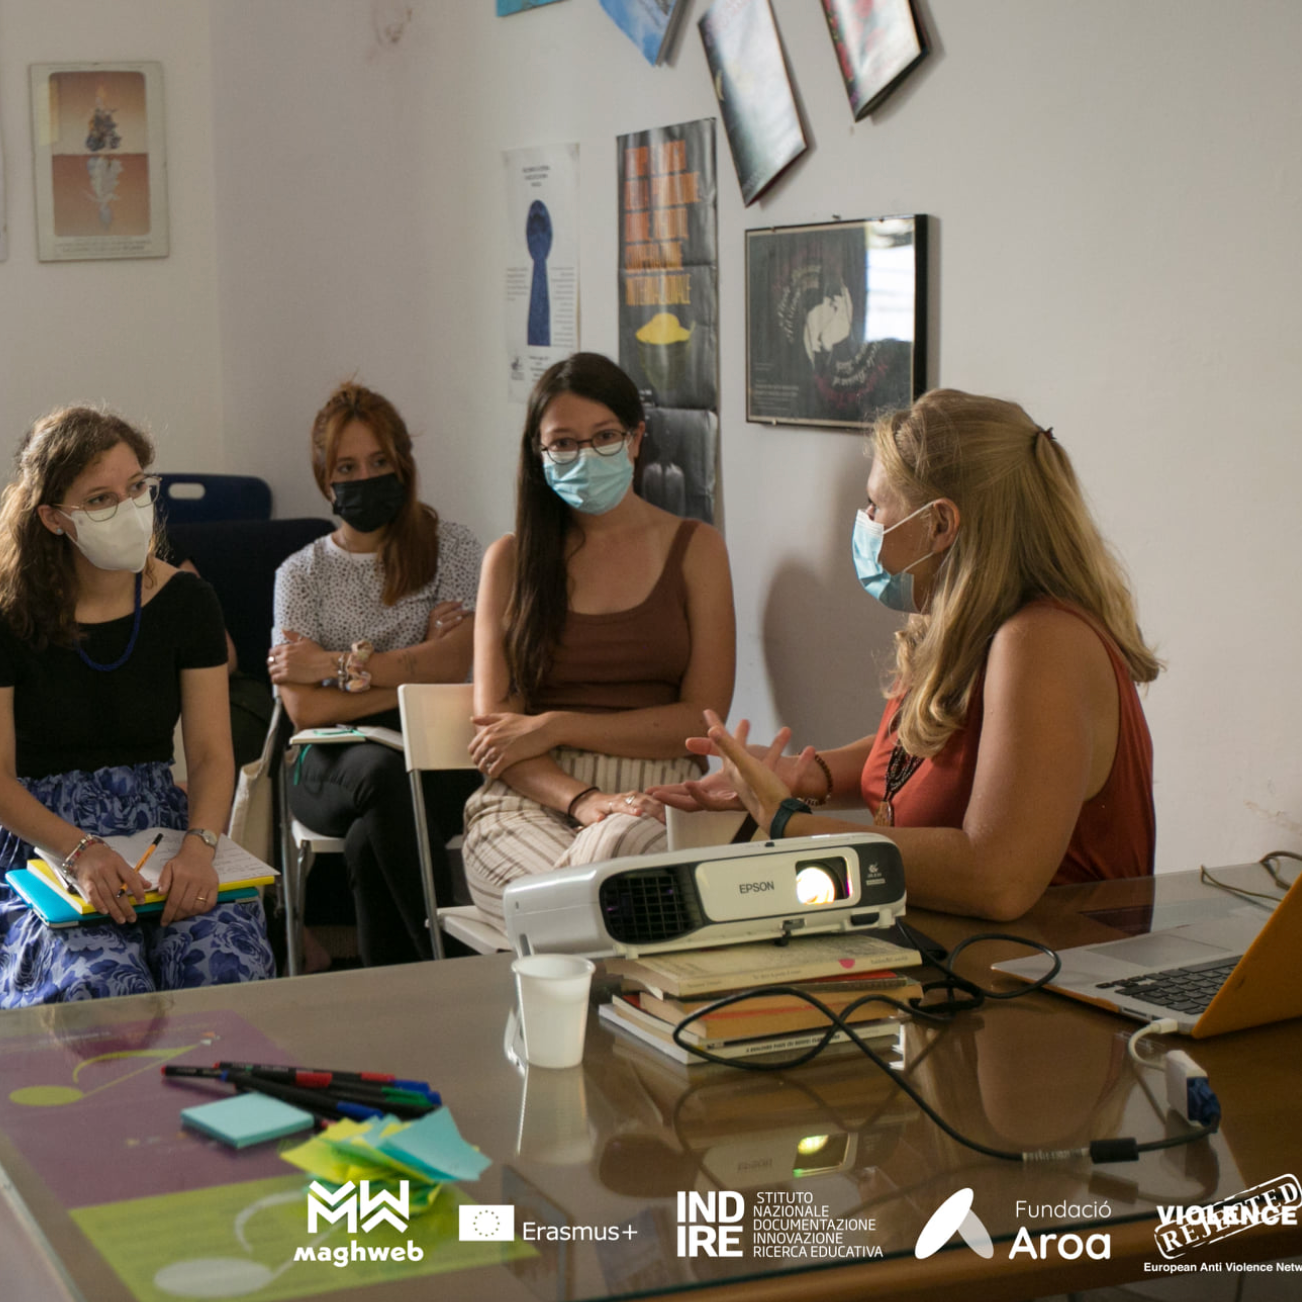
Data Feminism Workshop on critical data practices
A two-day workshop for women's rights organizations from Spain and Greece on data literacy for communicators, with a focus on how to work with data by applying the Data feminism critique throughout the different phases of a data project's workflow. The workshop combined both theory and practical activities.
MY ROLE: Workshop Lead
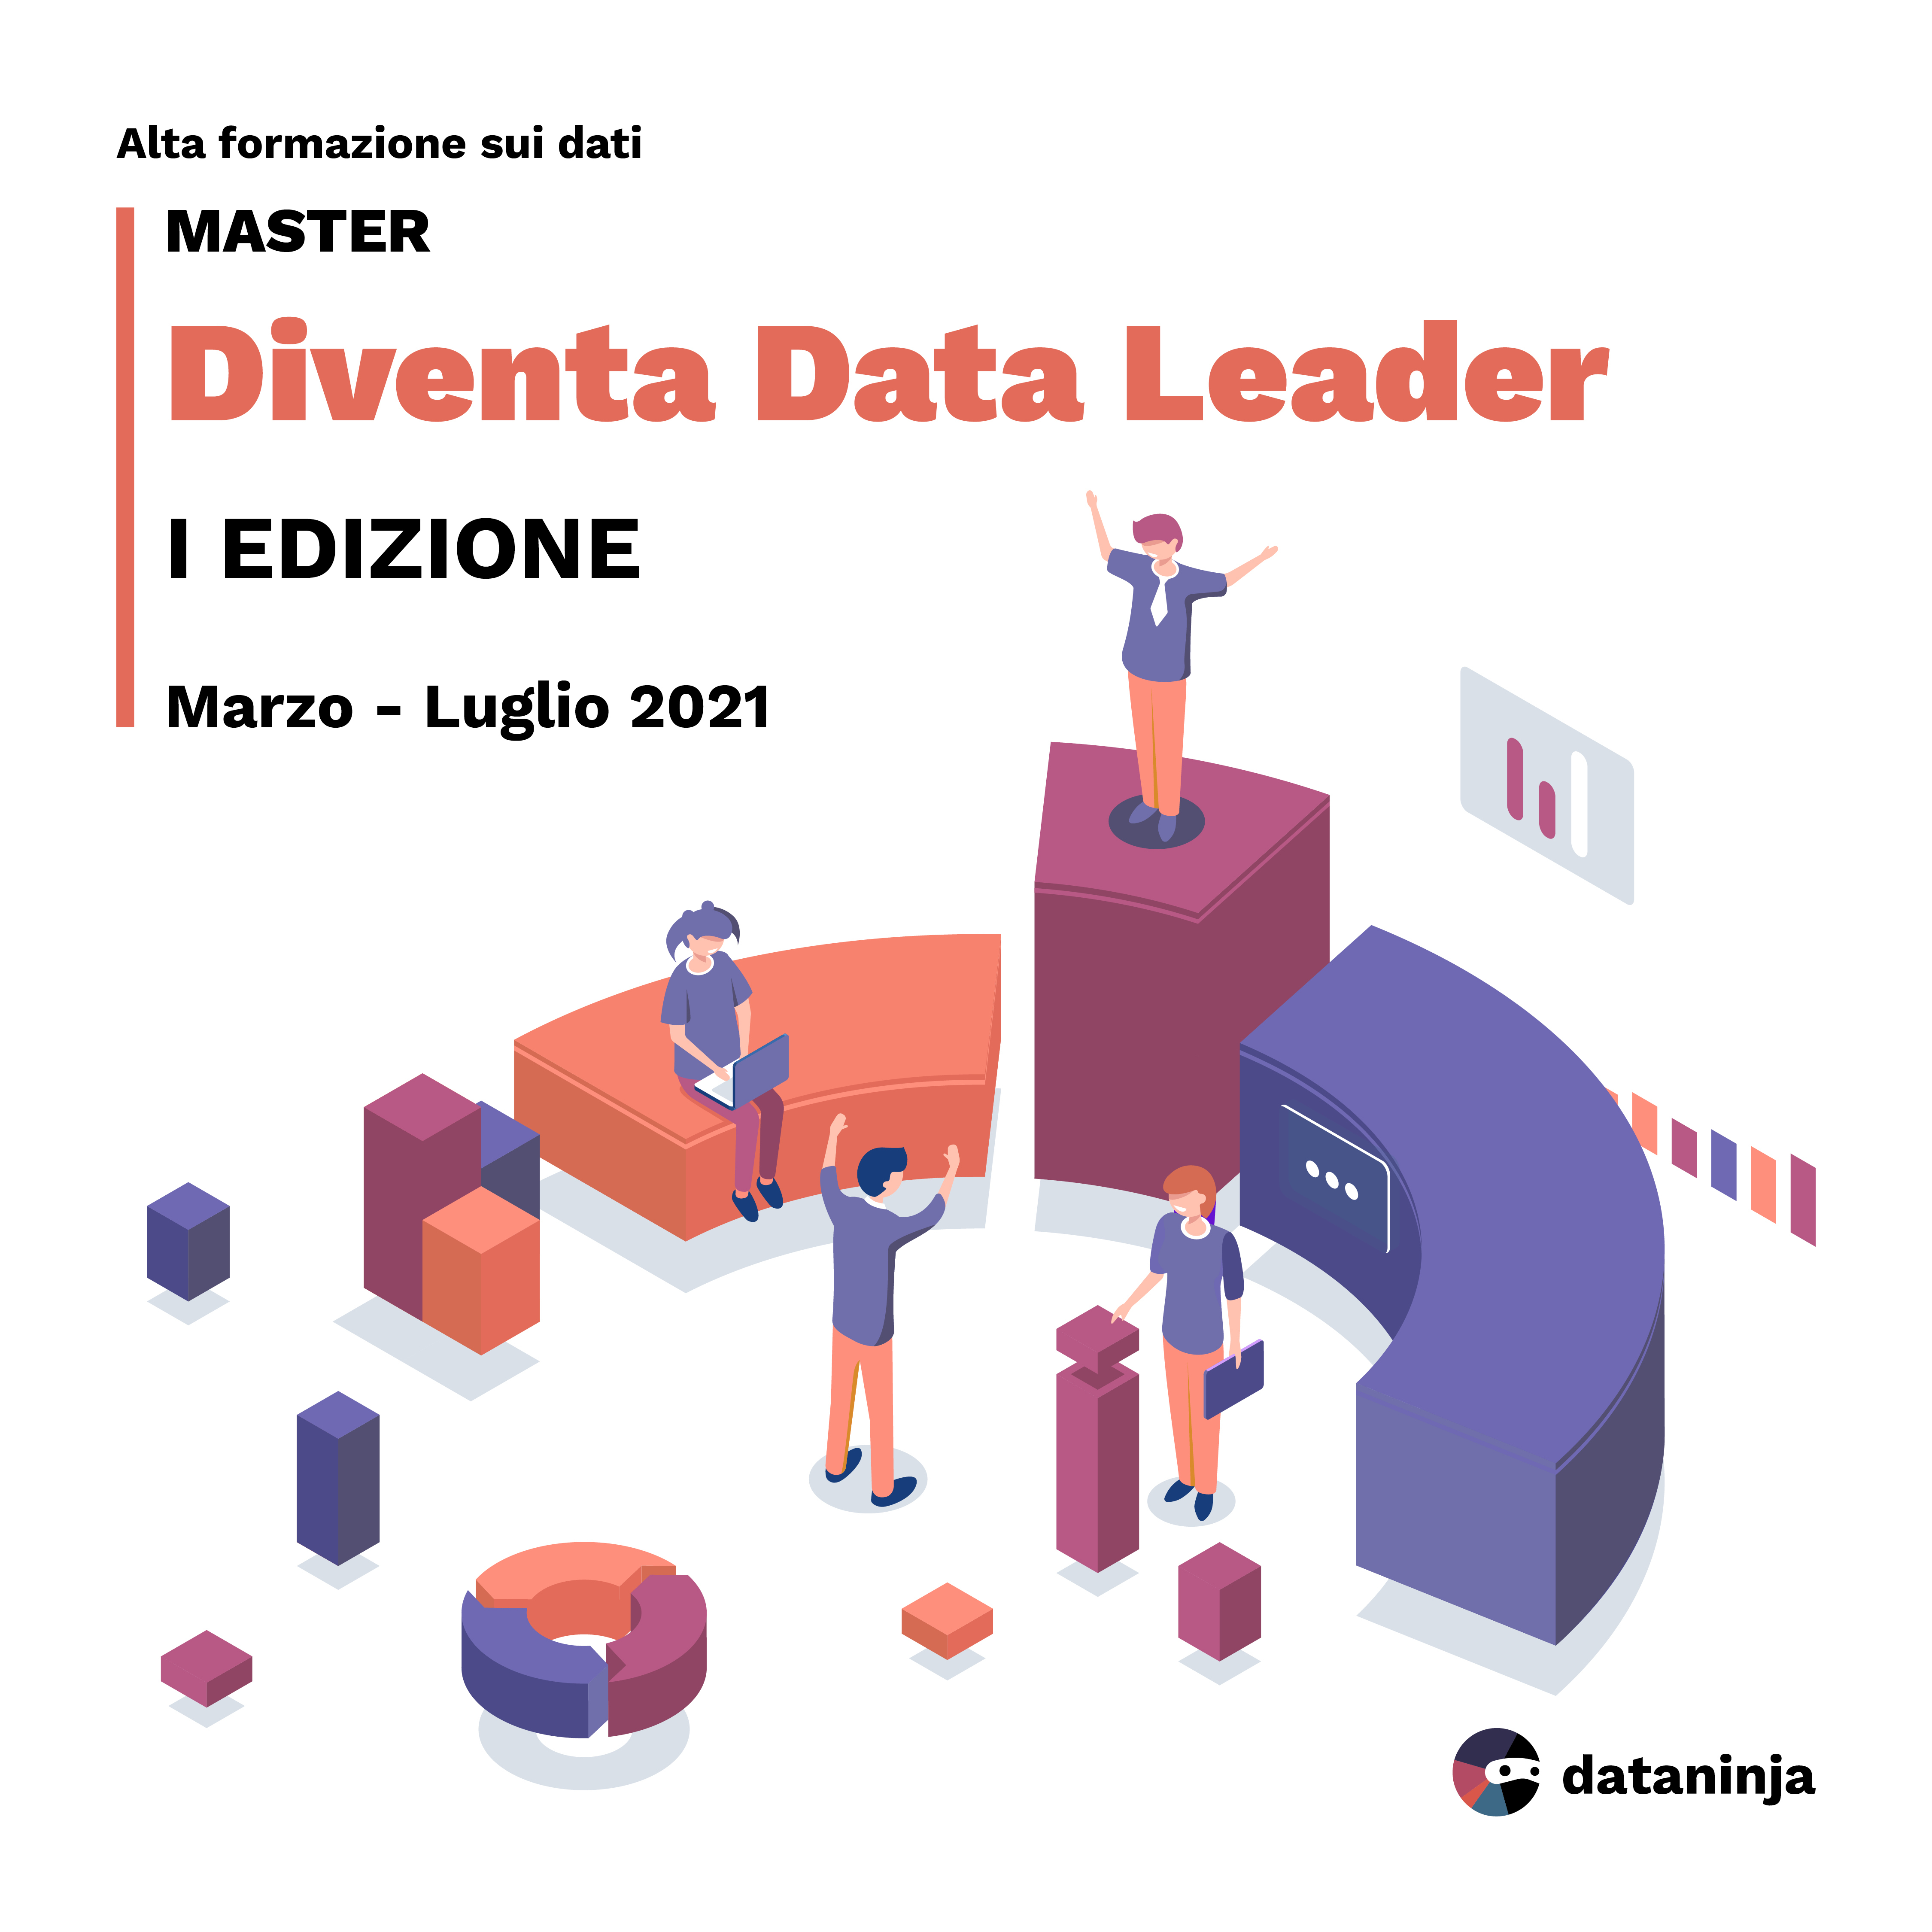
Master Alta Formazione sui dati Ed.1
16-weeks intensive learning program on data literacy, statistics, data visualization, and storytelling. I taught lessons on data formats, data sources, GSheet basic and advanced uses, Open Refine and data cleaning, and data visualization with Datawrapper, Flourish, Infogram and RawGraph. I also supported students in developing their group projects with the program's data partners: Fondazione Compagnia di San Paolo; MAXXI Museo nazionale delle arti del XXI secolo; LWT3; and Medici Senza Frontiere.
MY ROLE: Teacher and tutor
Graphic infotainment: comunicare con i dati
An intensive 8-weeks online program for female SME female entrepreneurs focused on open-source tools to incorporate data analysis and data communication in their brand marketing strategy.
MY ROLE: Instructor

Data Storytelling - MA Course
I taught a 10-hour module on Data Storytelling in the Data Science MA at Bologna Business School.
MY ROLE: Contract Professor
Cleaning data with Open Refine - Webinar
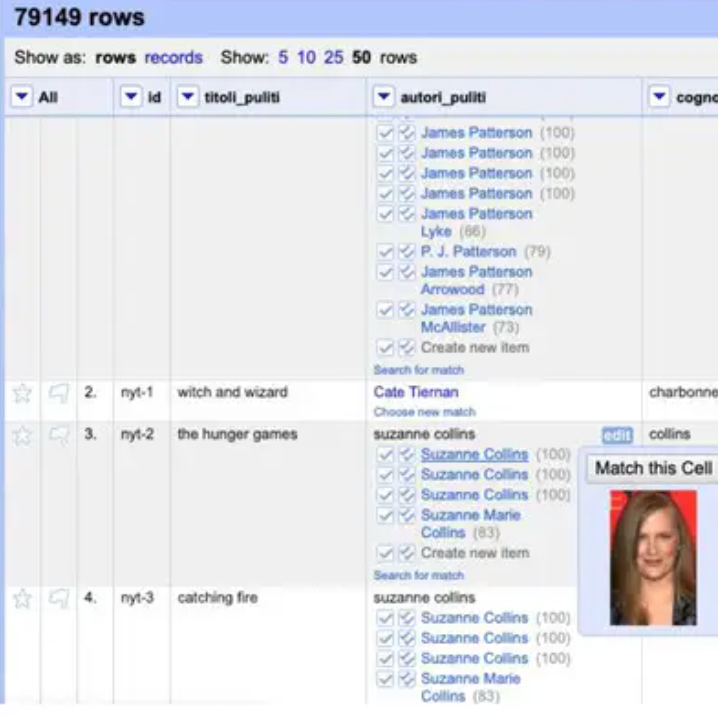
A 60-minute crash course on using Open Refine to clean and enhance data, including its most advanced features, such as LOD reconciliation, GREL, and clustering algorithms.
MY ROLE: Webinar Creator and Instructor
Data visualizations in vector graphics with RawGraphs - Webinar
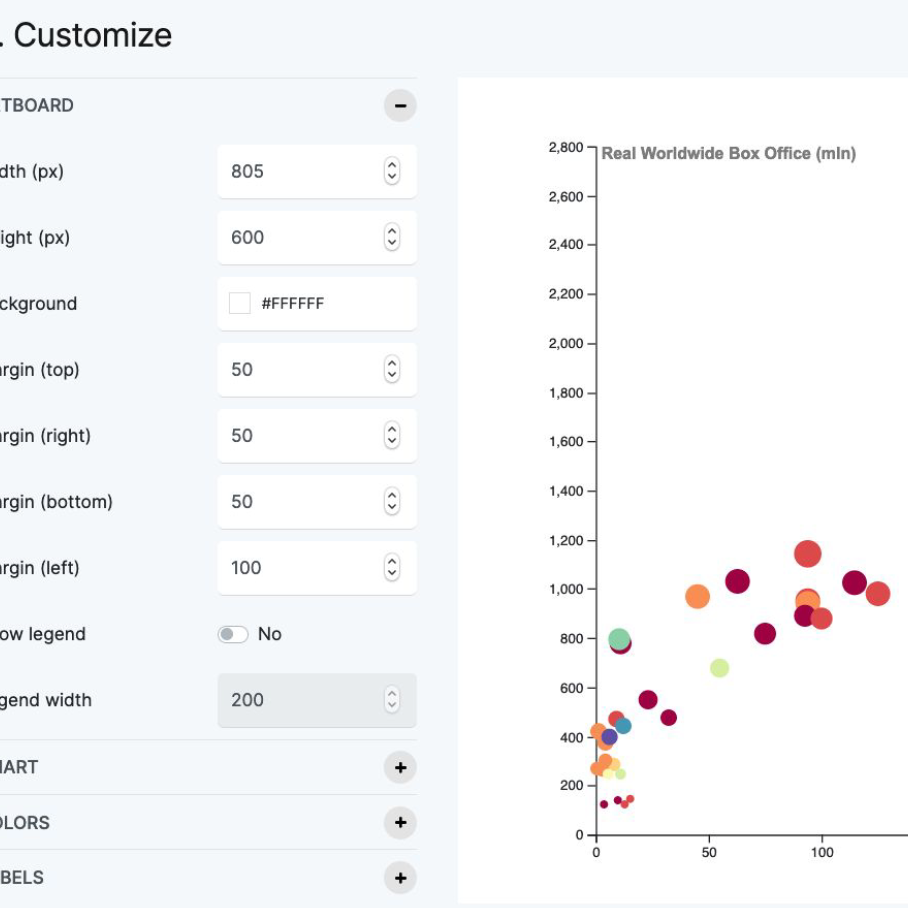
A 60-minute crash course on vector graphics and on using the open-source tools RawGraphs and Inkscape to create and edit data visualizations in the .SVG format.
MY ROLE: Webinar Creator and Instructor
2020
Create an Infographic - Course
A course with a step-by-step process to create an infographic, including tutorials on how to use the tools Canva and Infogram.
MY ROLE: Course Creator
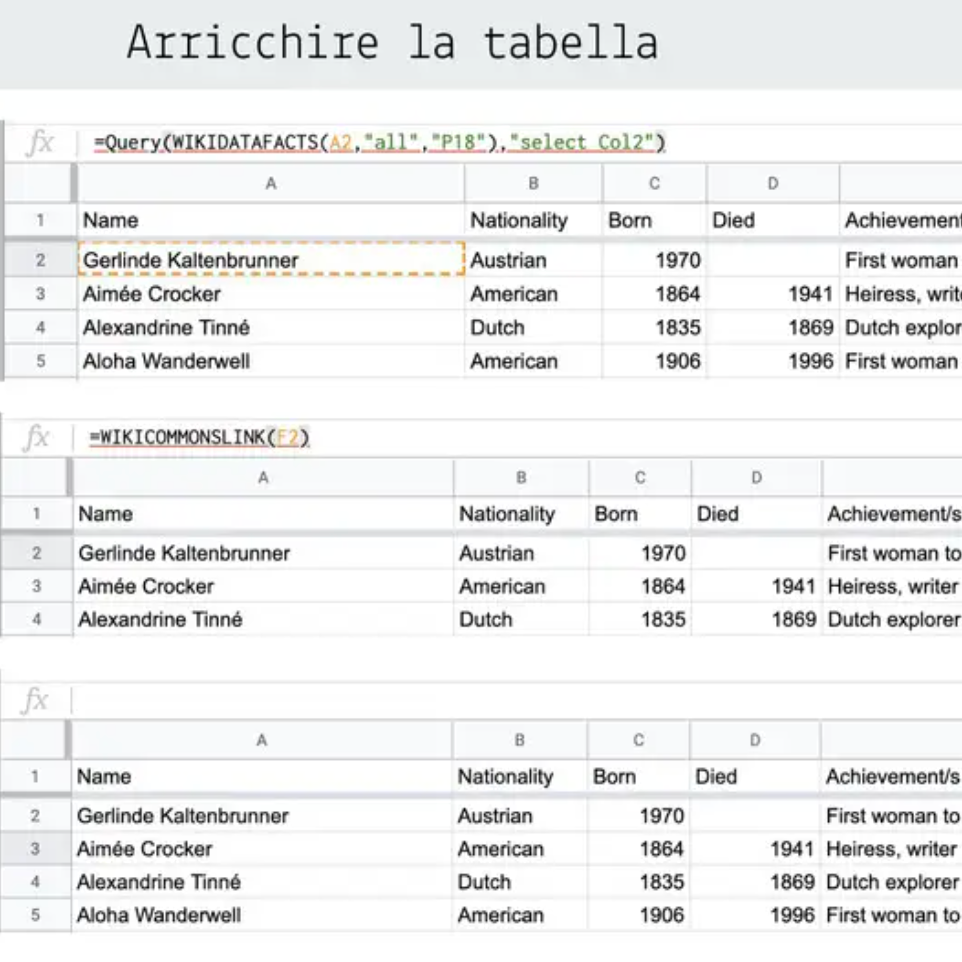
Let's play with data from Wikipedia - Webinar
A 30-minute crash course on extracting data from Wikipedia into a Google Spreadsheet, through Wikidata queries.
MY ROLE: Webinar Creator and Instructor
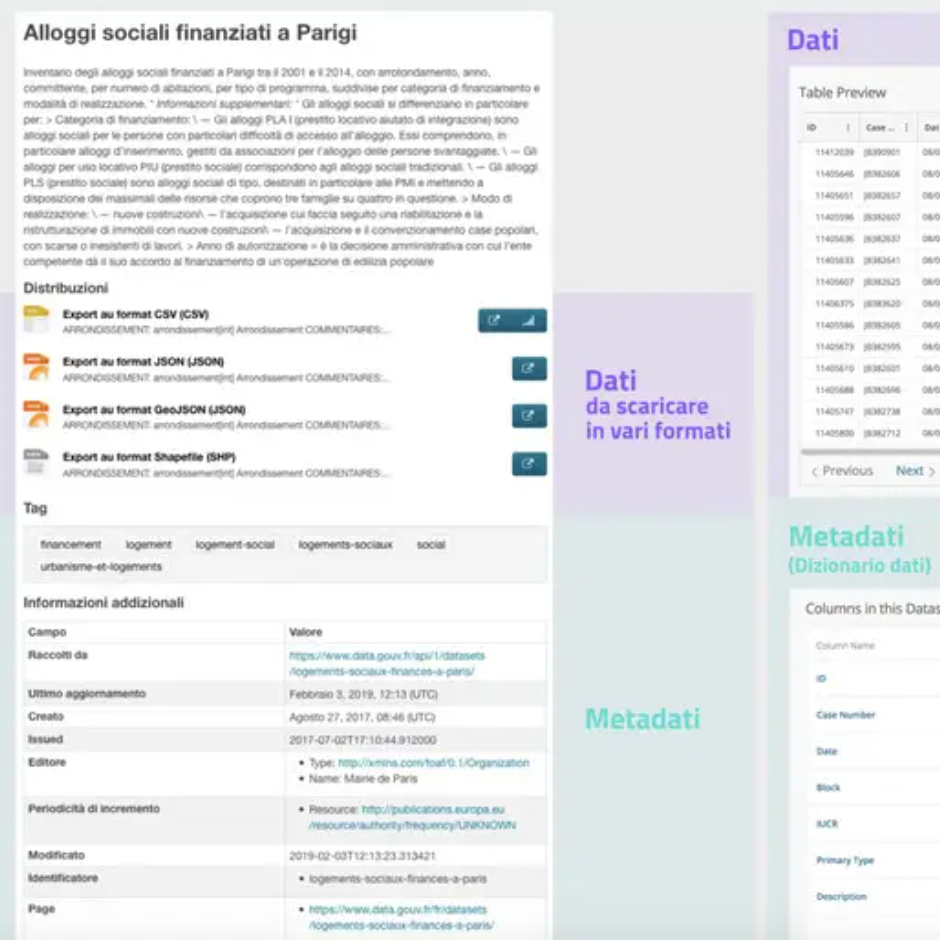
Where to find data - Webinar
A 30-minute crash course on the different types of data sources, from open data portals to scraping and APIs.
MY ROLE: Webinar Creator and Instructor
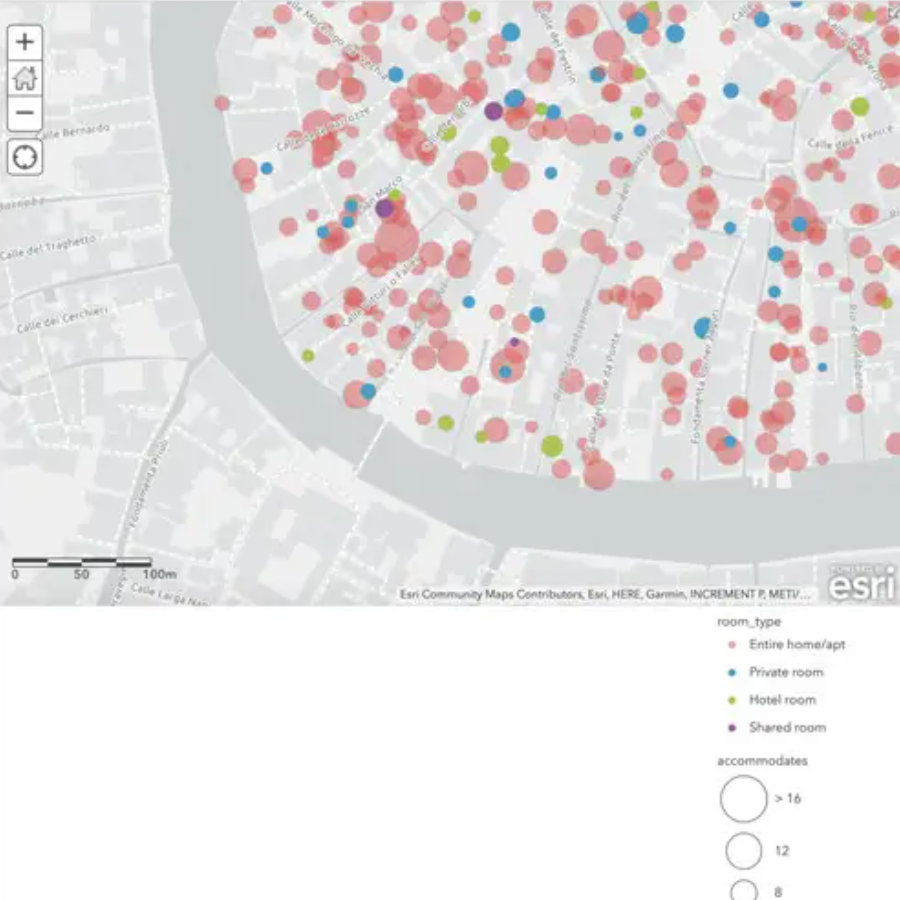
Create your first map - Webinar
A 60-minute crash course on maps: from geodata formats to projections, from choosing a map type to using online tools such as Datawrapper, ArcGIS Online, and Flourish .
MY ROLE: Webinar Creator and Instructor
Make your data visualizations more inclusive - Webinar
A 60-minute crash course on making sure data visualizations are accessible and inclusive.
MY ROLE: Webinar Creator and Instructor
Data Literacy and Data Viz - Programs for NGOs and businesses
I guided company employees and not-for-profit employees through custom data literacy and data visualization learning programs. In this context, I worked with Generali, Expleo, Sapere Digitale and A Scuola di Open Coesione.
MY ROLE: Course creator and tutor
Data Storytelling - MA Course
I taught a 10-hour module on Data Storytelling in the Data Science MA at Bologna Business School.
MY ROLE: Contract Professor
2019
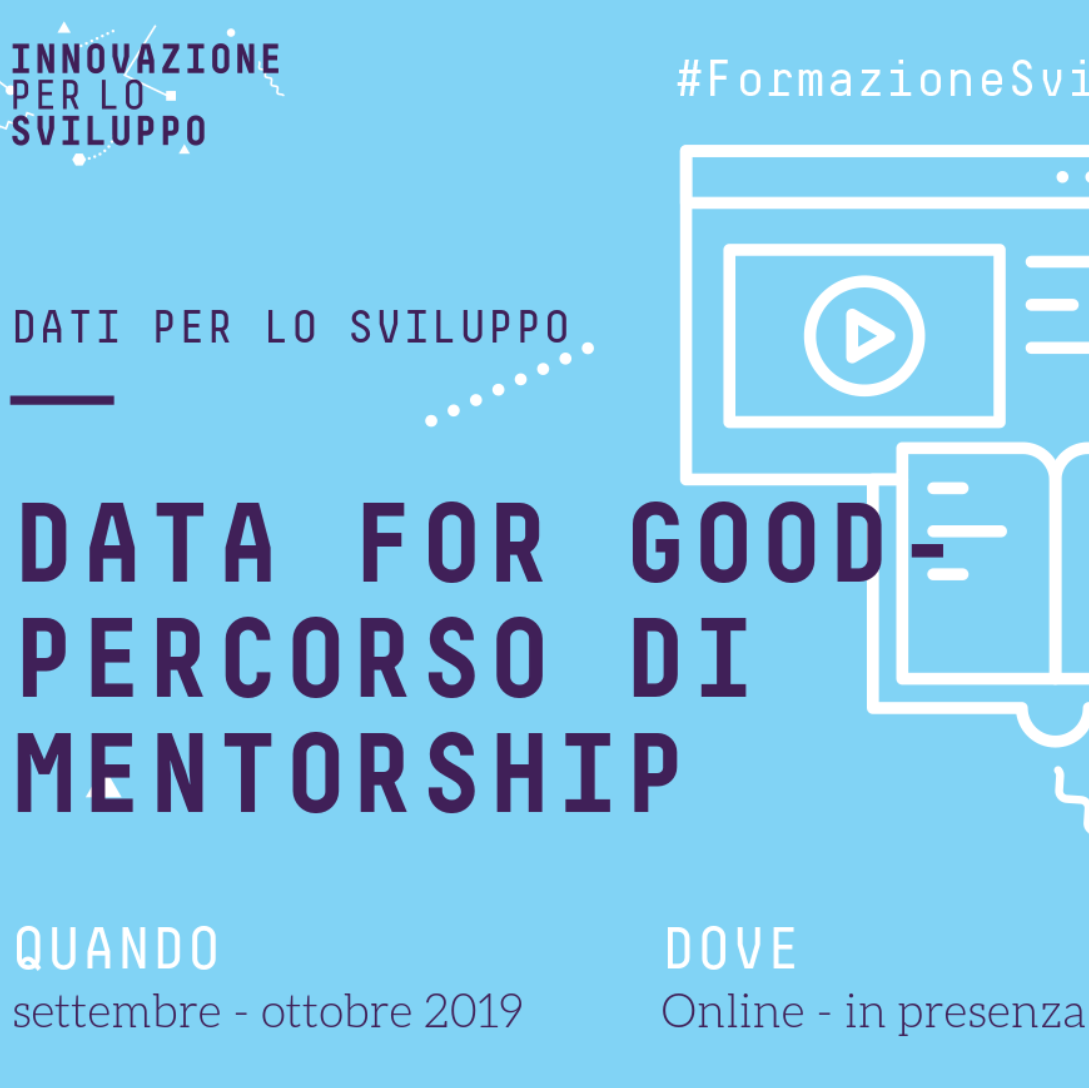
Data for Good - Mentorship Program
The mentorship consisted of a self-paced online learning program and of a three-day intensive live Data Camp. At the end of the mentorship, the participating NGOs developed visualization and storytelling prototypes to communicate their datasets.
MY ROLE: Mentor
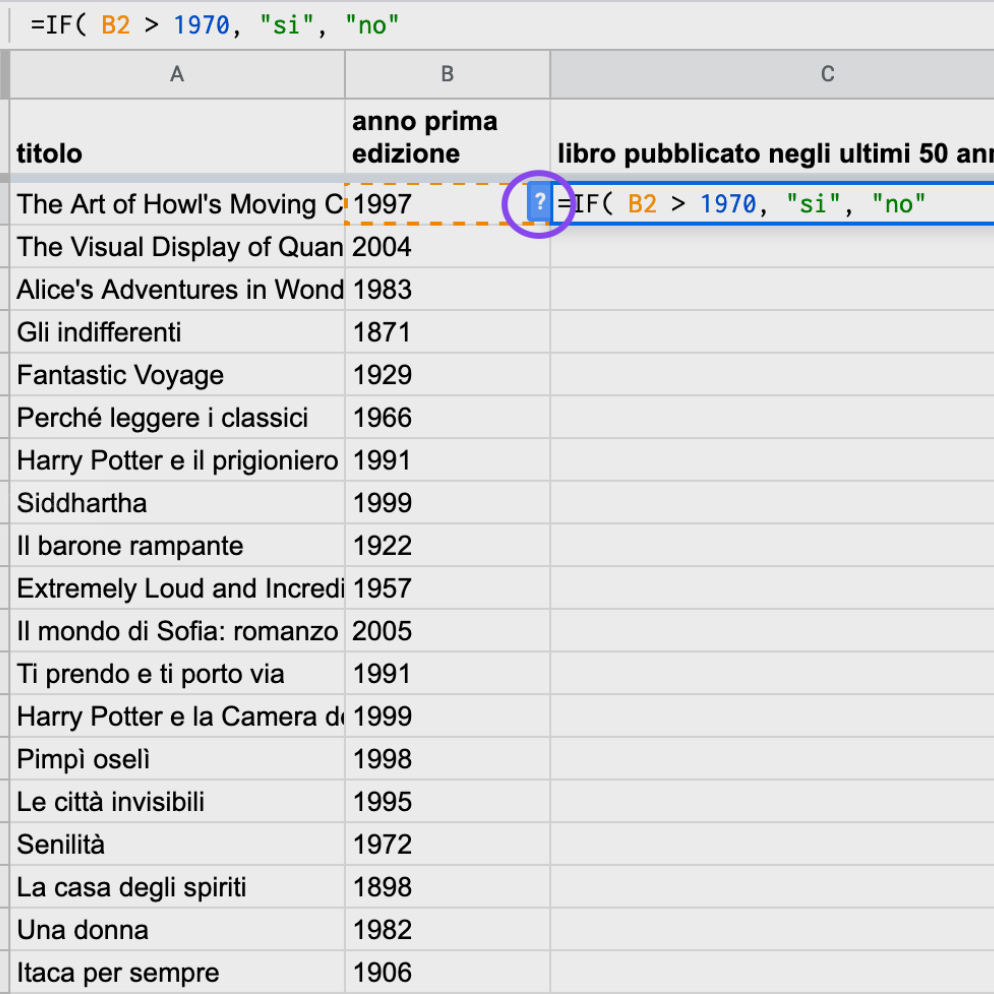
Introduction to Data - Course
An introductory data literacy course, covering topics such as data formats, data cleaning, basic statistics, Google Spreadsheet formulas, and Pivot Tables.
MY ROLE: Course Creator
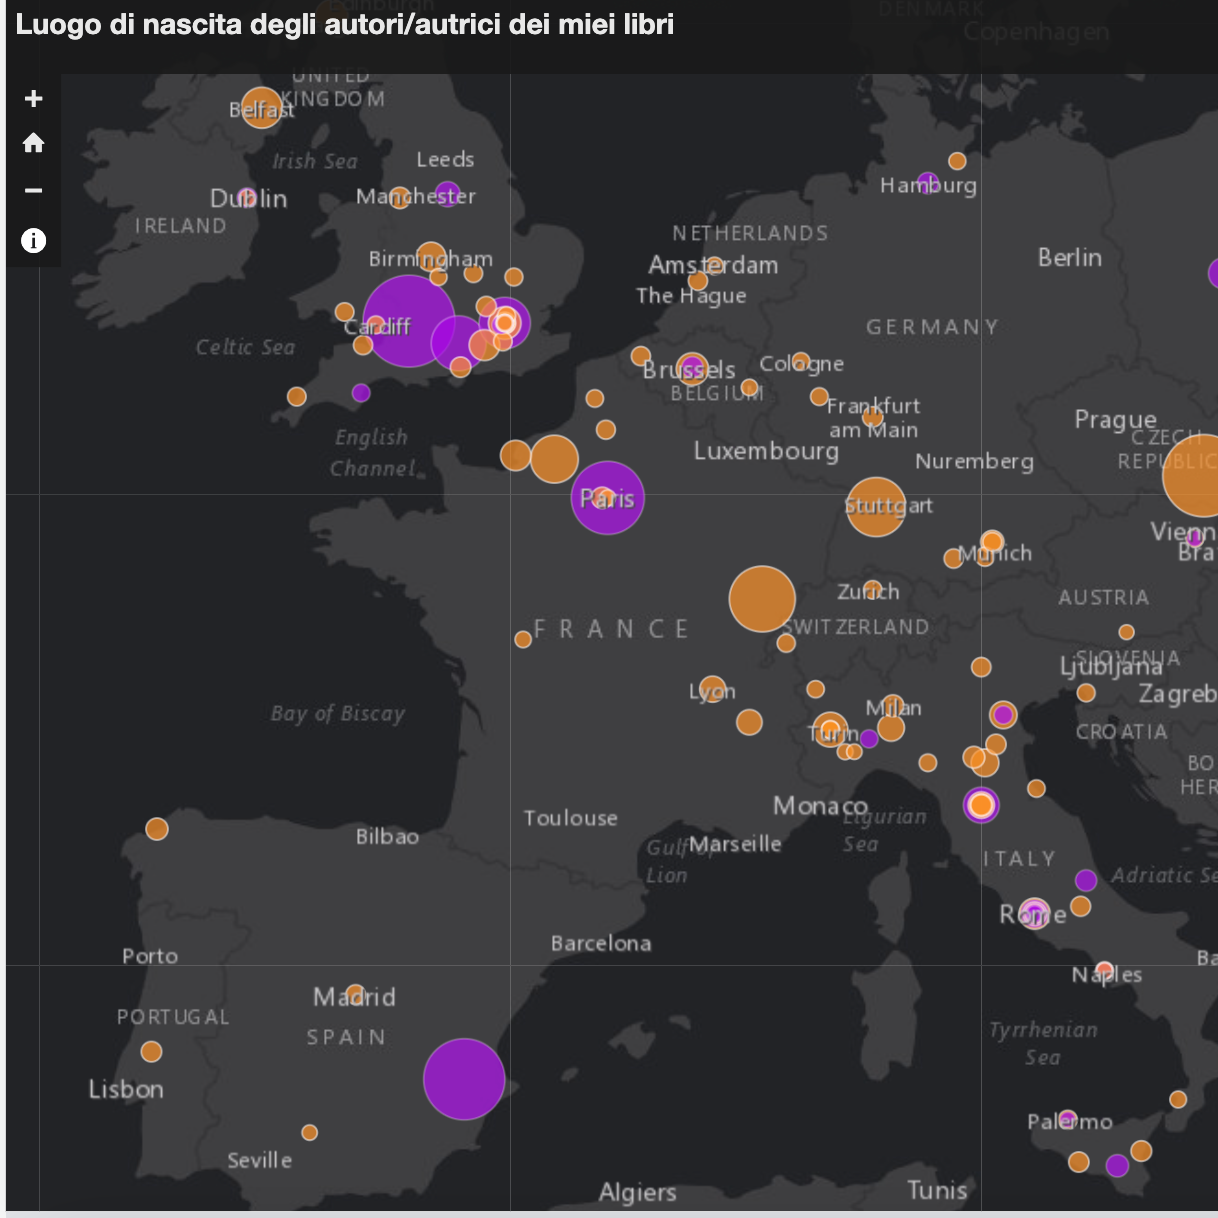
Data Visualization - Course
A course on the theory and practice of data visualization, including tutorials on how to use the tools Datawrapper, Floruish, and ArcGIS Online to create interactive charts and maps.
MY ROLE: Course Creator
Data Storytelling - MA Course
I taught a 10-hour module on Data Storytelling in the Data Science MA at Bologna Business School.
MY ROLE: Contract Professor
2018
Data Storytelling - MA Course
I taught a 10-hour module on Data Storytelling in the Data Science MA at Bologna Business School.
MY ROLE: Contract Professor
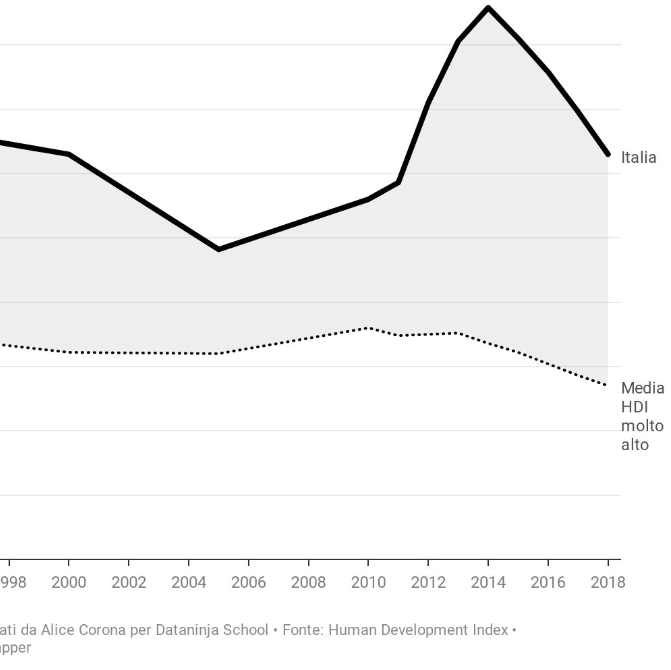
Data Visualization Skills - Course
An online course created in collaboration with Dataninja for students of the University of Milan.
MY ROLE: Instructor
2017
A Data Journalism Primer - Guest Lecture
Guest lecture on data journalism to students of the Data Science MA.
MY ROLE: Instructor
2016
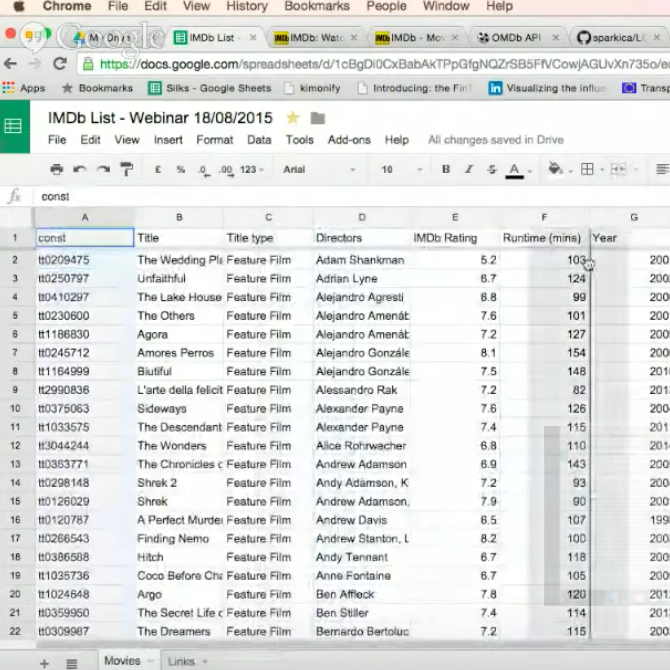
Data Journalism Workshop
A step-by-step workshop during the event Shift, Shape Mobilize by Sourcefabric. The workshop covered APIs, Gsheets advanced formulas, and Open Refine, to quantify the gender gap among directors awarded at movie festivals.
MY ROLE: Workshop Lead
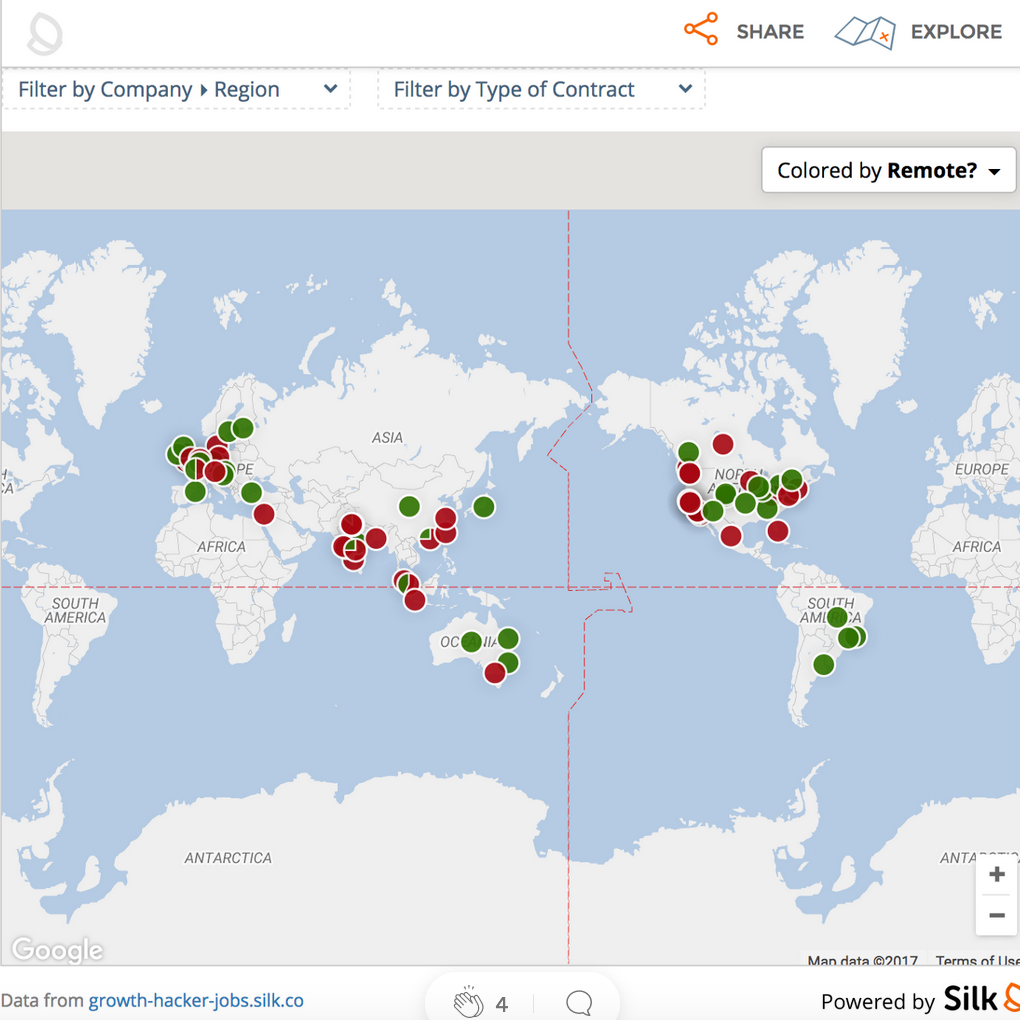
Hack your career: how to use data to monitor job markets
A step-by-step workshop during on how to scrape the web to monitor and visualize job market dynamics.
MY ROLE: Workshop Lead
How to use build and organize your dataset
A webinar on preparing spreadsheets for your projects.
MY ROLE: Workshop Lead
2015
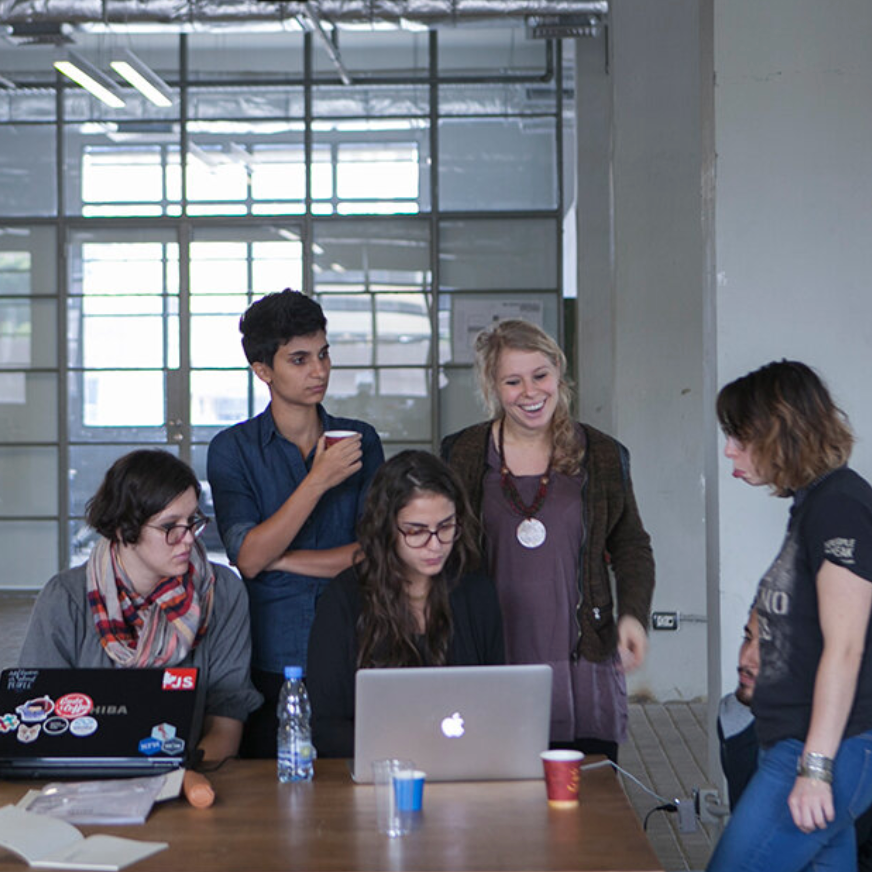
Data4Change 2015 Beirut Design Sprint
A 5-days design sprint for Civil Society Organizations from Syria, Lebanon, Egypt, and the Gulf region, to prototype a data storytelling product to communicate each CSO's data. As a floating mentor, I provided support to the various groups.
MY ROLE: Mentor & Support
Silk's Summer Webinar: Cleaning and enhancing datasets with the Silk data team
The webinar focuses on cleaning and enhancing data. In the webinar, I share tips, tricks, and tools I use to make data look pretty.
MY ROLE: Instructor